How ChatGPT turned a screenshot into a data chart
#AI use case of the day: make charts out of images 📊
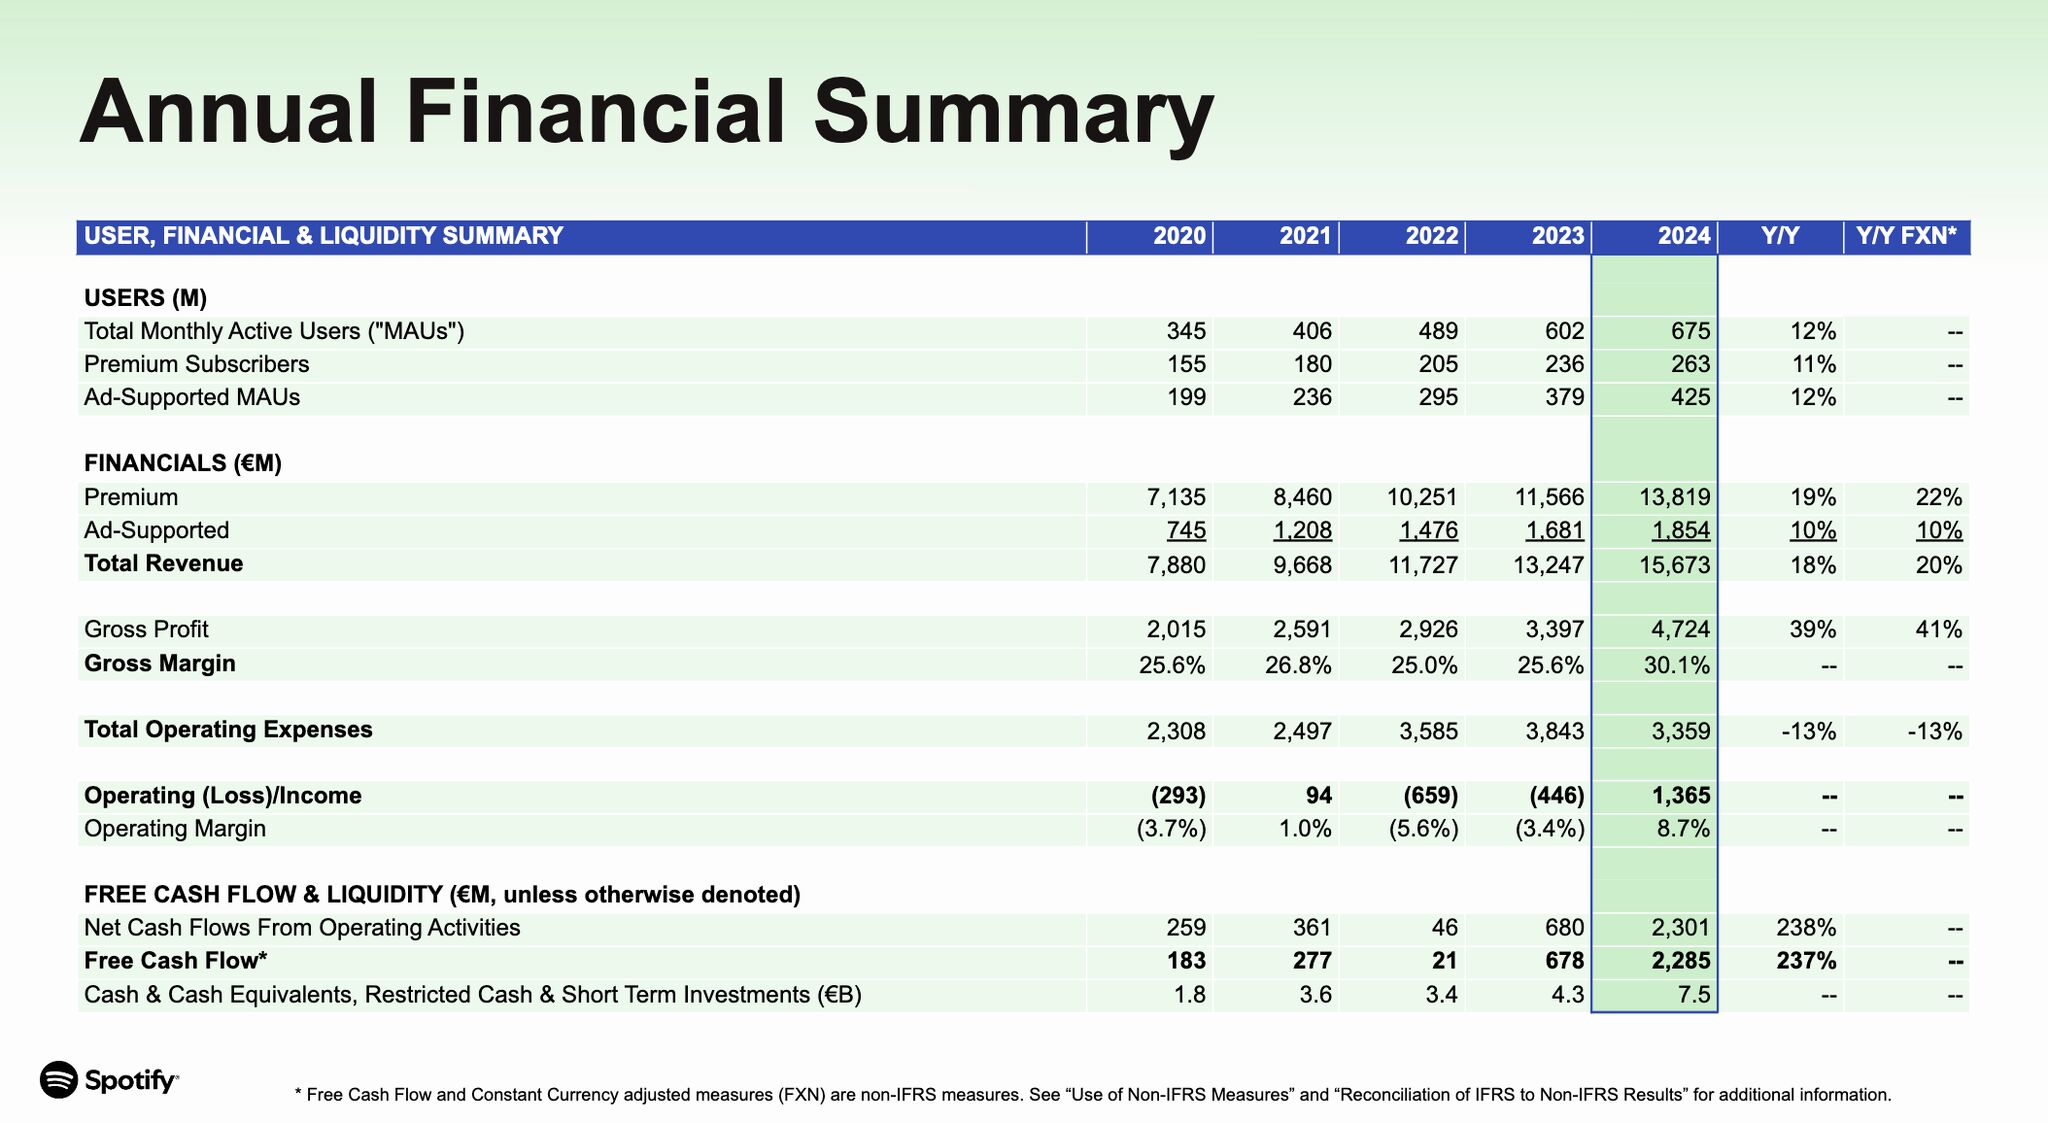
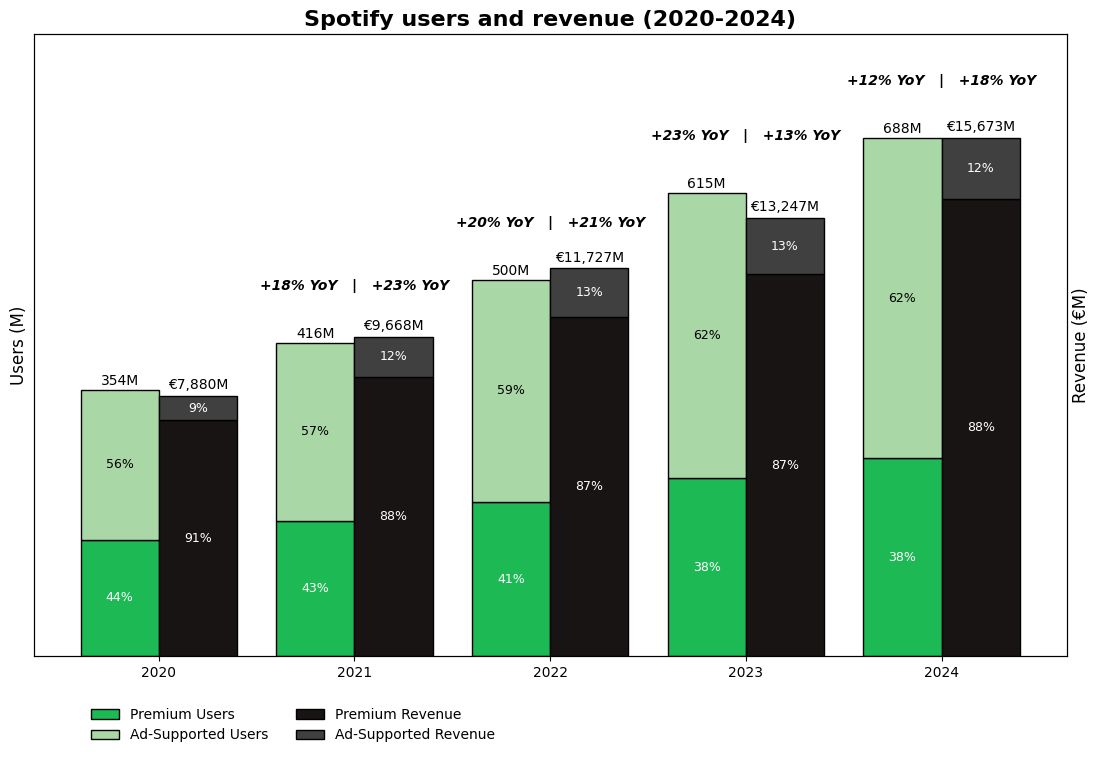
Yesterday I posted some data about Spotify. All charts were made with ChatGPT.
No Excel, no PowerPoint, no copy-pasting numbers.
1. Asked GPT to find Spotify's latest financial report.
2. Took a screenshot of the Annual Financial Summary table
3. Uploaded screenshot in ChatGPT and asked to make a chart out of it.
Sure, it took me a while to chat my way through the final result, it was worth it!
Would have I been faster by just copy-pasting numbers into Excel?
maybe... but what if I was dealing with a more complex table? I guess I would have given up.
AI helps:
-> Make existing tasks faster.
-> Unlock tasks you would have never done otherwise.