AI use case of the day:
infographics made in minutes.
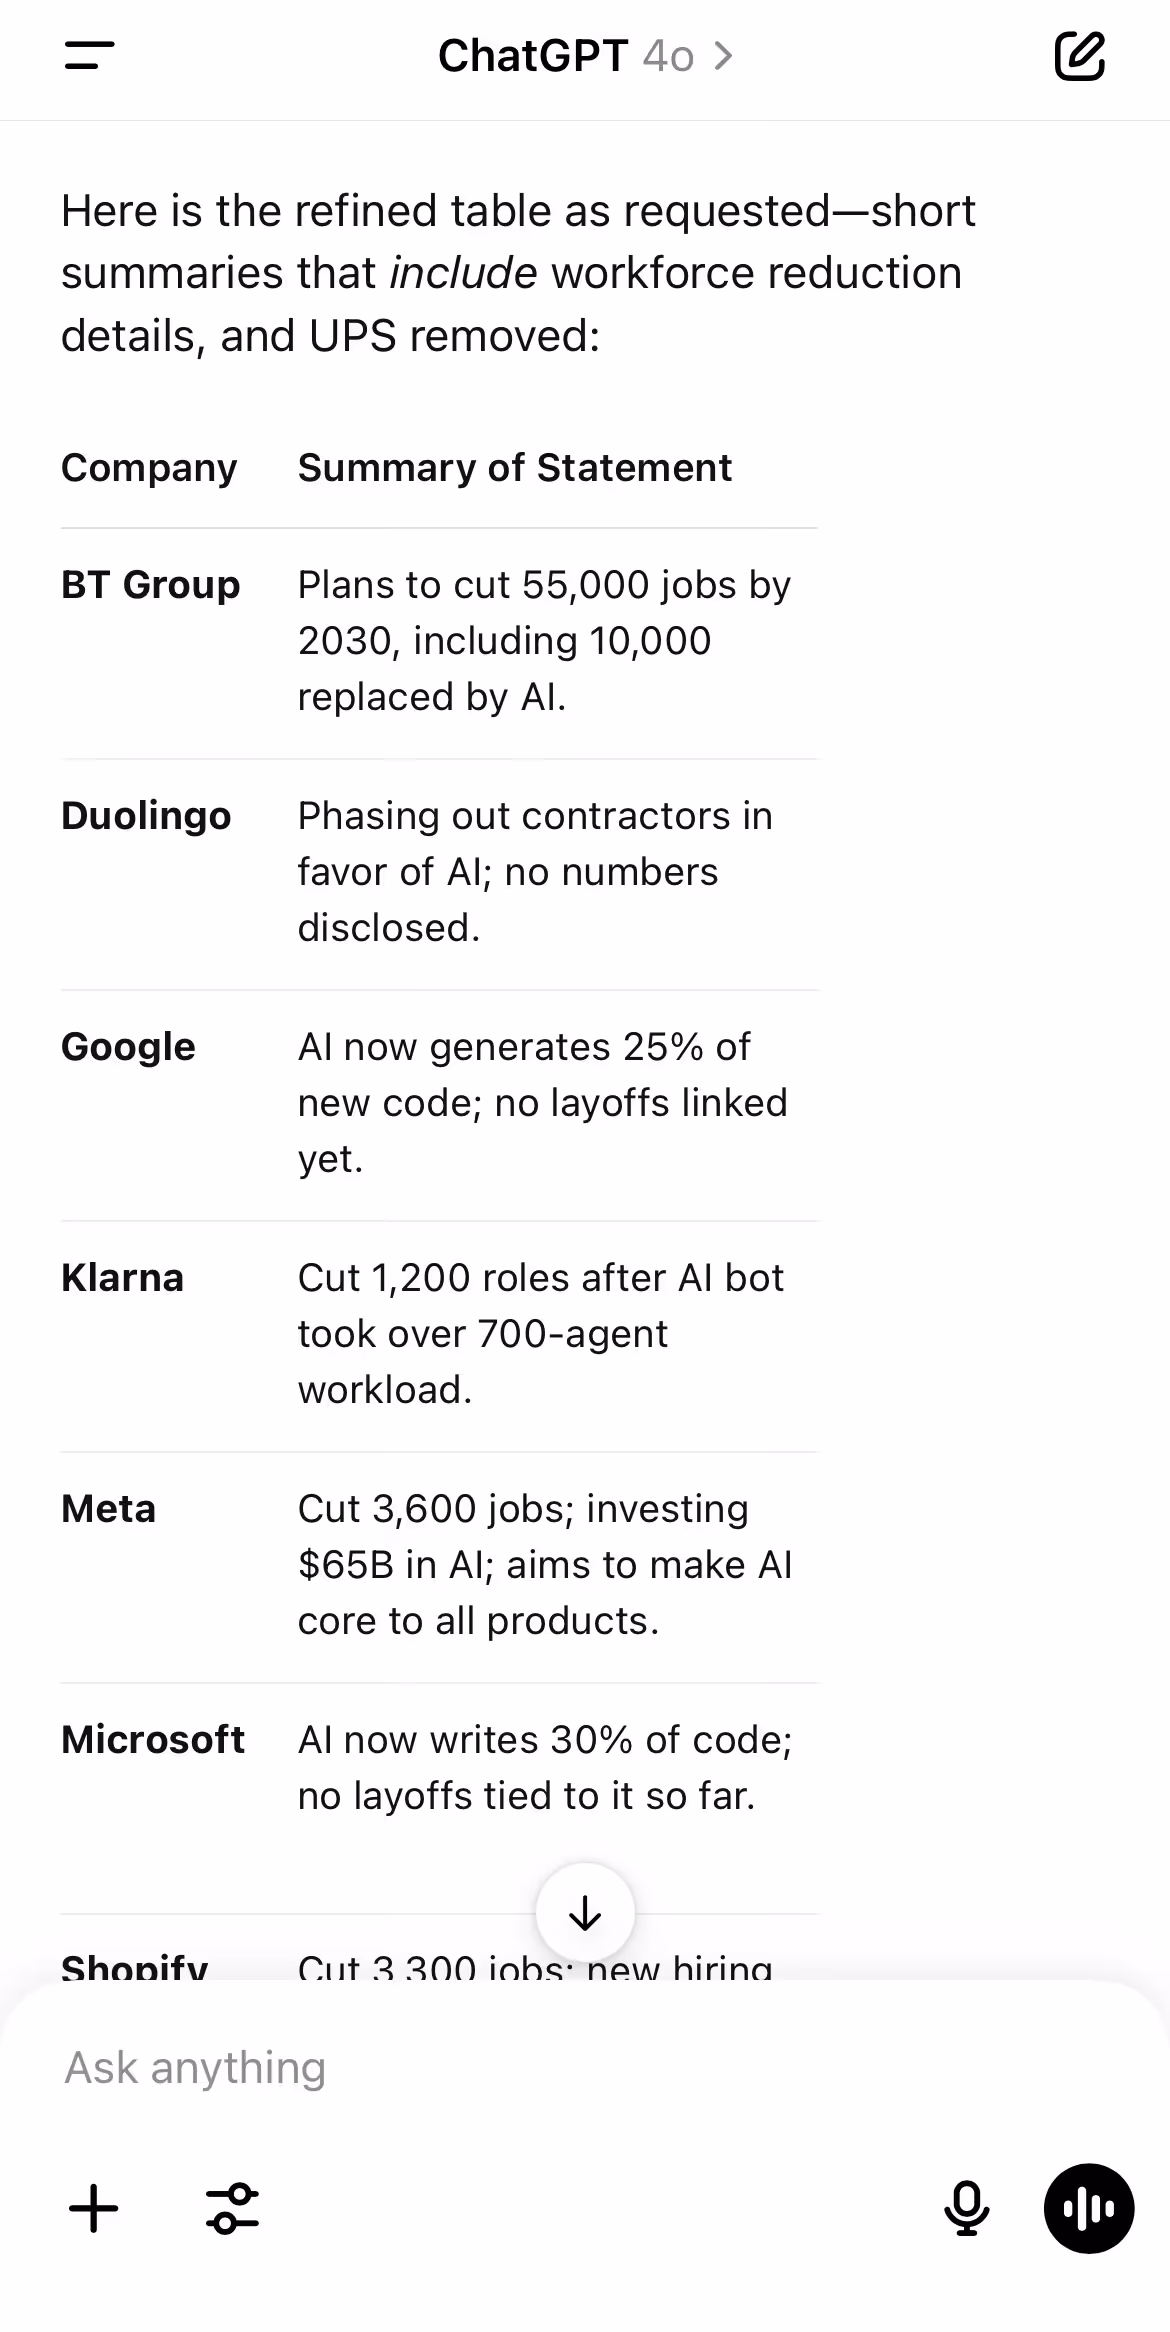
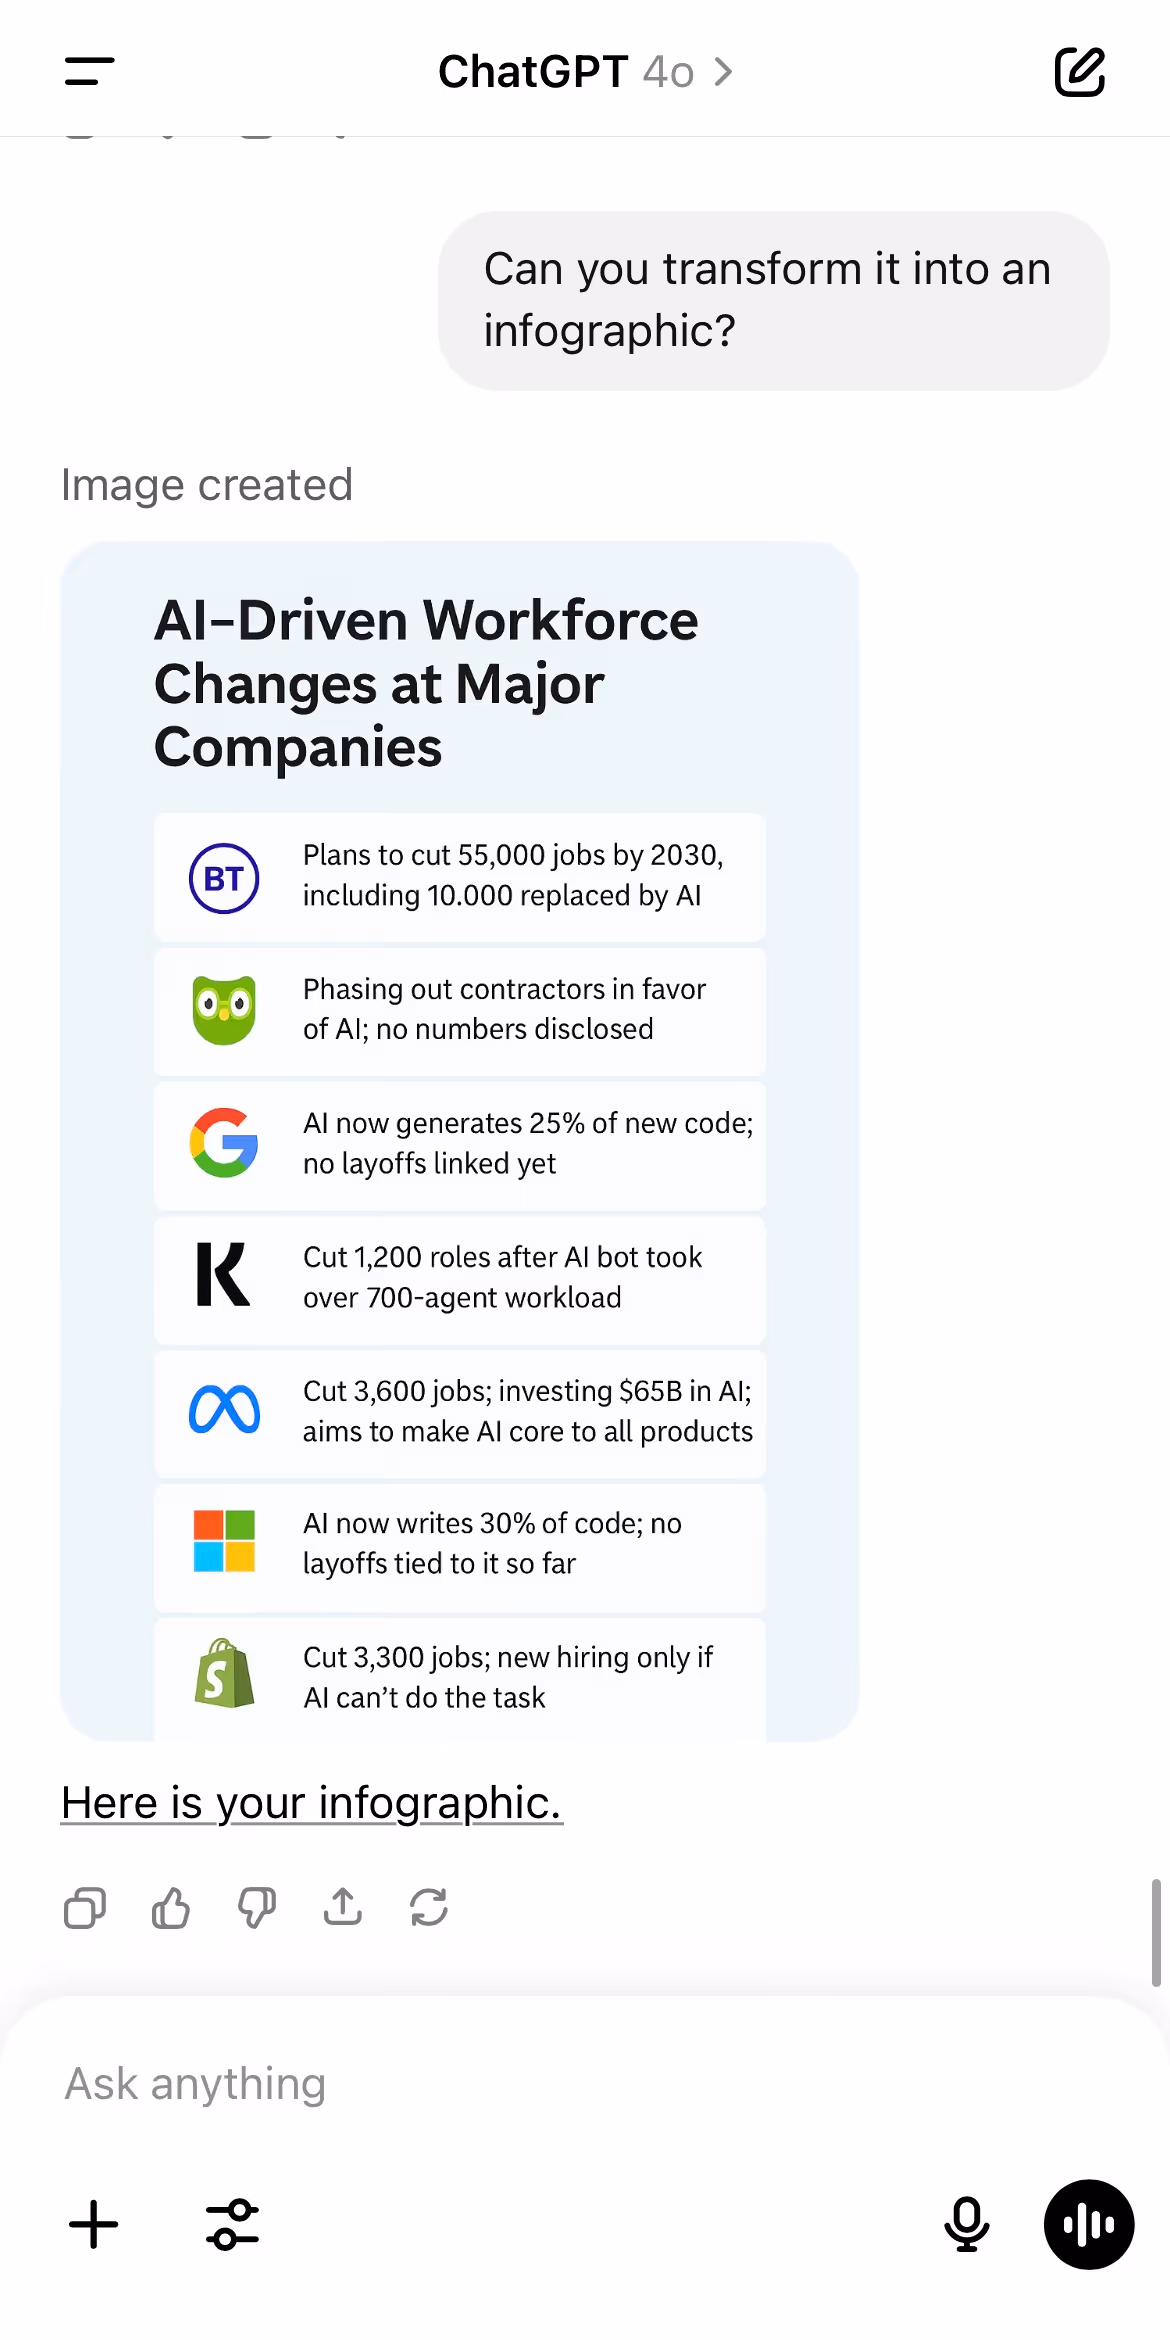
A few weeks ago, I shared a visual breakdown of AI-driven workforce shifts at major companies.
It looked great and data-rich.
And it was 100% AI-generated, with ChatGPT.
Here’s how I did it:
· Asked GPT to list companies that publicly announced AI-related layoffs or workforce changes.
· Turned that list into a clean, structured table.
· Transformed the table into an infographic.
No prompts about colors.
No design instructions.
No layout preferences.
The first result was already spot on.
From idea to post in minutes!