ChatGPT and Colab turn market data into charts fast
Ai use case of the day:
draw financial charts in minutes.
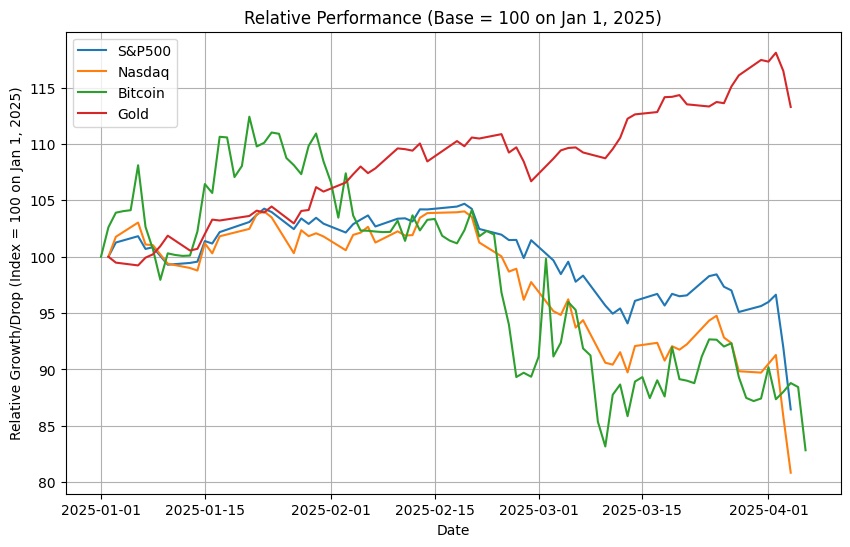
Few days ago I published a chart showing the performance of some financial assets including Bitcoin and Gold.
Instead of downloading the data from somewhere and format a chart in Excel (would have taken me around an hour), I asked ChatGPT to make it for me (few minutes work).
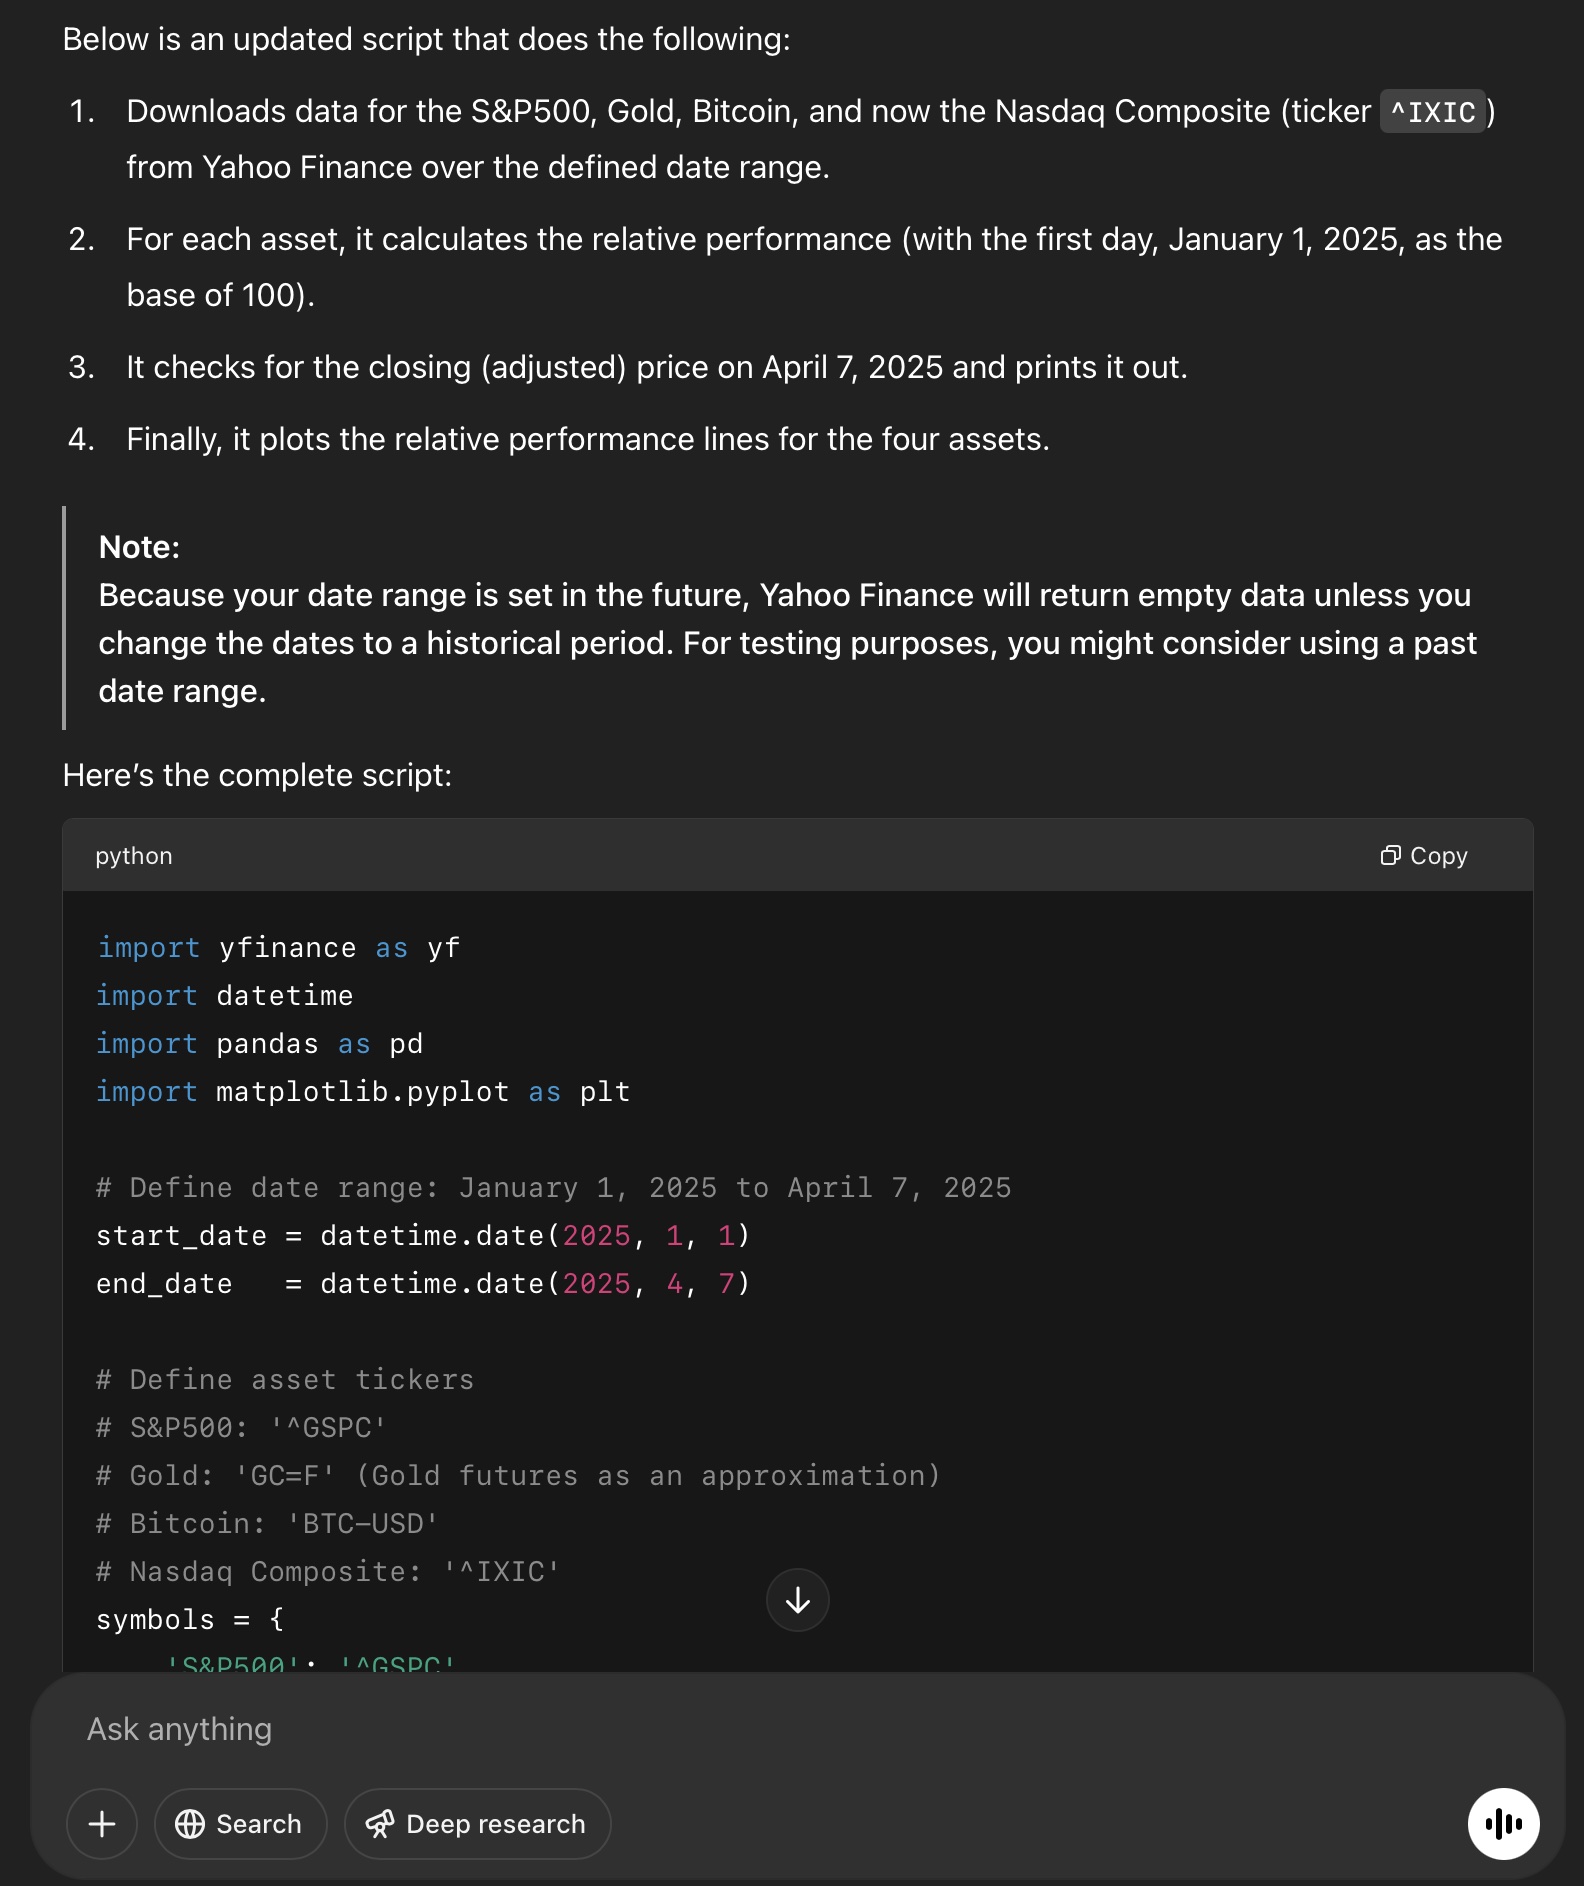
Lately, I've been a bit disappointed with the Data Analysis feature of GPT, therefore I just asked to write a Python script and I simply pasted it into Google Colab.
Step 1: ask GPT to create a Python script.
Step 2: create a new project in Google Colab.
Step 3: literally just paste the script in the project.
Step 4: click on the play icon and run the script.
Step 5: download the chart in an image format.
That't it!